
Six tools show up when developers search for the best GitHub pull request analytics tools in 2026, and only one of them is built for a single developer instead of an entire engineering org.
- Pull Tally wins for individual developers tallying merged pull requests for reviews or job-search prep.
- GitHub's native Insights tab is the free option for a quick, single-repo pulse check.
- LinearB and Swarmia target engineering managers who need team-wide cycle time and DORA data.
- Jellyfish ties merged work to roadmap items for engineering leadership, not individual contributors.
- The best github pull request analytics tools split cleanly by audience: solo developer versus team platform.
Why this matters
GitHub's own UI never built a clean way to answer "what did I merge last month, across every org I contribute to?" You can write a search query with is:pr is:merged author:you, but doing that every quarter for a performance review or every week during a job search turns into repetitive copy-paste work.
That gap is why a small category of pull request analytics tools exists in 2026, and why they split hard by audience. Pull Tally was built for the developer side of that gap: one person, their merged pull requests, filtered by month, organization, or personal repository. Everything else on this list was built for a manager or a VP looking at a team, not a contributor looking at their own history.
The tool you need depends on who's asking the question — you, your manager, or your VP.
What makes the best GitHub pull request analytics tool
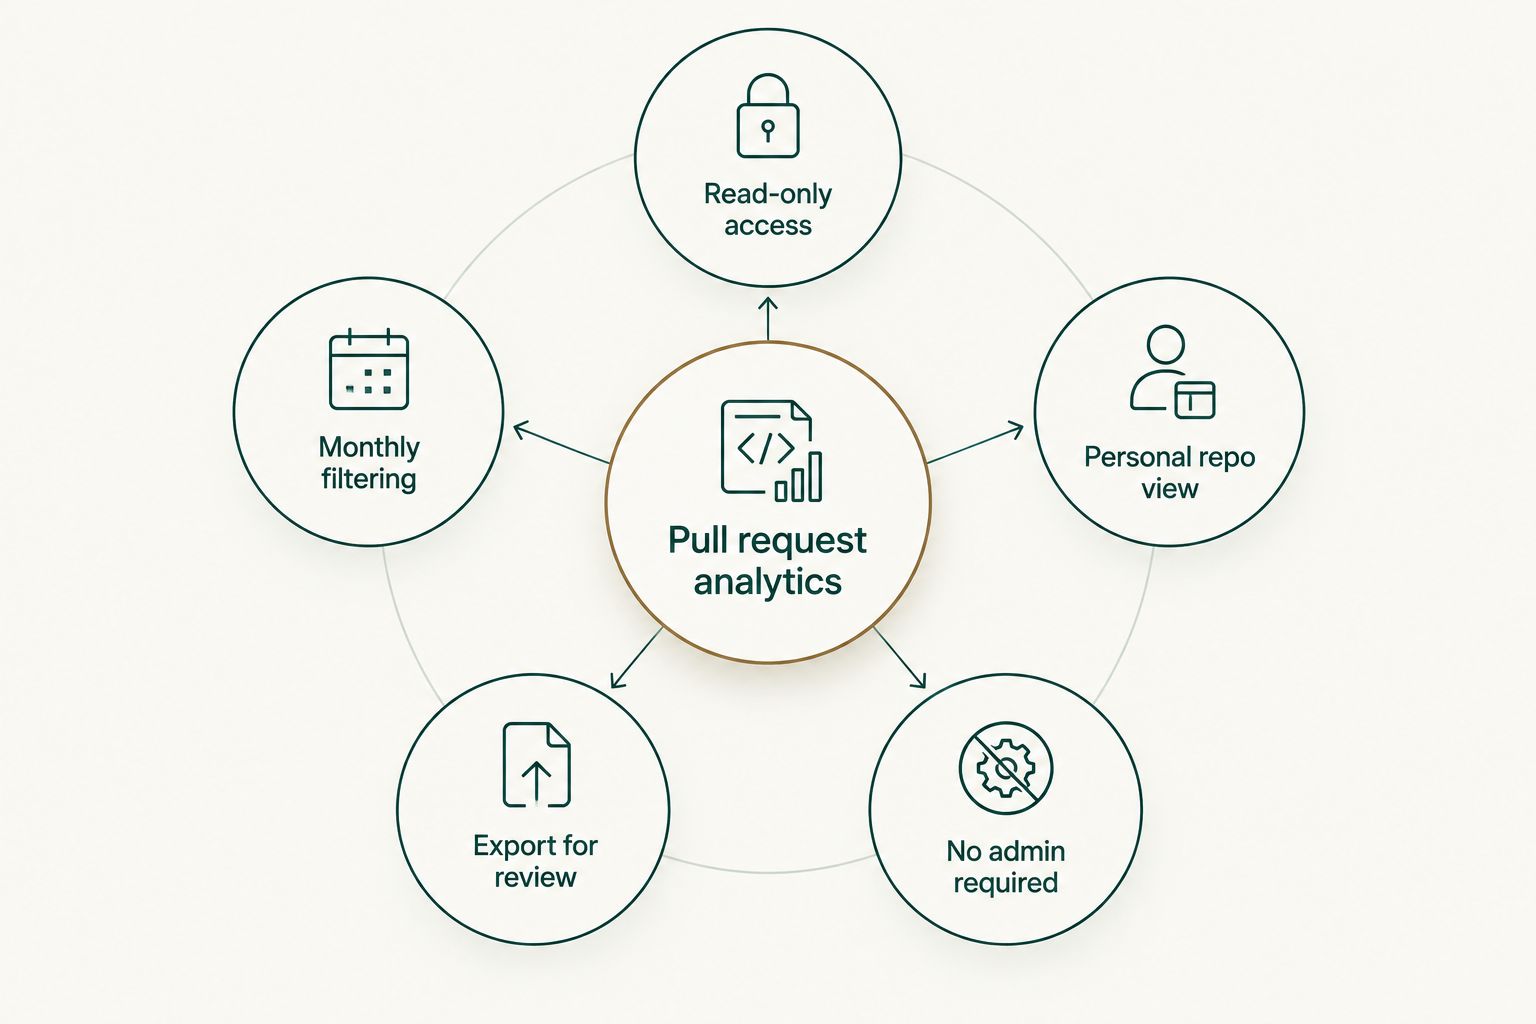
- Read-only access requests, not write permissions to code, settings, or org membership
- Filtering by month, organization, or personal repository, not just a lifetime activity dump
- A view built for individual contributor history, not only team-wide dashboards
- Output you can actually paste into a self-review, promo packet, or resume
- No admin install or org-wide rollout required just to check your own merged PRs
- Plain disclosure of what data gets touched and why, before you connect anything
GitHub pull request analytics tools at a glance
| Tool | Best for | Standout feature | Key limitation |
|---|---|---|---|
| Pull Tally | Individual developers tracking merged PRs for reviews and job search | Filters merged PRs by month, org, or personal repo | No team-wide dashboards or manager views |
| GitHub Insights (native) | A free, no-signup pulse check on one repo | Built into GitHub, zero setup | No cross-repo or cross-org rollup of merged PRs |
| LinearB | Engineering managers tracking team delivery metrics | Cycle time and WIP tracking across a team | Built for management reporting, not a single contributor's history |
| Swarmia | Teams monitoring DORA metrics and developer experience | Combines DORA data with survey-based DX signals | Needs org-wide rollout to produce useful data |
| Jellyfish | Engineering leadership tying work to roadmap outcomes | Maps merged PRs to initiatives and business goals | Overkill for anyone who just wants a monthly PR count |
1. Pull Tally: best GitHub pull request analytics tool for individual developers
Pull Tally is a web tool for one developer's merged pull request history, not a team dashboard. Sign in with GitHub, browse pull requests you've merged, and filter the list by month, by organization, or by a single personal repository. It reads pull request metadata only — signing in alone does not connect private organization repositories, and nothing about the tool writes back to your code or settings.
Pull Tally pros:
- Filters merged PRs by month, organization, or personal repo without manual GitHub search queries
- Read-only access to pull request metadata, explained plainly rather than buried in a permissions screen
- Built around personal delivery history, not a productivity score
- Useful raw material for a self-review draft, promo packet, or job-search timeline
Pull Tally cons:
- No team rollups, manager dashboards, or cycle-time metrics — this is a personal view only
- No DORA metrics or org-wide reporting, by design
Pull Tally best for: a developer who needs a plain, filterable record of merged PRs to build a self-review, promo document, or a brag document ahead of a performance cycle.
Verdict: Buy — if the question is "what did I personally merge this year," this is the shortest path to an answer in 2026.
2. GitHub Insights (native): best free pulse check on a single repo
GitHub Insights is the built-in tab already sitting inside every repository you have access to. It shows a pulse view, contributor activity, and traffic data with zero setup and no separate signup.
GitHub Insights pros:
- Zero setup — it's already inside GitHub
- Free for any repo you have access to
- Shows contributor activity and traffic at a glance
GitHub Insights cons:
- Covers one repo at a time, with no cross-org rollup of merged PRs
- No export built for a review document or promo packet
- The pulse view resets on a short cycle, not a running monthly tally
GitHub Insights best for: a quick spot check on one repo's recent activity when you don't need history.
Verdict: Hold — fine for a glance, not built for review prep.
3. LinearB: best for engineering managers tracking team delivery metrics
LinearB is built for engineering managers who need cycle time, work-in-progress counts, and delivery metrics rolled up across a team's repositories. It treats pull requests as one input into a broader delivery pipeline view, not as a personal record.
LinearB pros:
- Cycle time and WIP tracking across multiple contributors
- Dashboards built for engineering managers, not individual developers
- Connects delivery data to project management tools for reporting
LinearB cons:
- Requires org-wide setup and admin access — not something a single contributor installs alone
- Built for management reporting, not a developer's own merged PR history
LinearB best for: an engineering manager who needs team-level delivery metrics for a whole squad, not one person's record.
Verdict: Hold for individual developers; Buy for engineering managers evaluating team tooling.
4. Swarmia: best for teams monitoring DORA metrics and developer experience
Swarmia combines DORA-style delivery metrics with survey-based developer experience data, aimed at teams running regular retros around delivery speed and friction points.
Swarmia pros:
- Combines DORA metrics with survey-based developer experience signals
- Useful for identifying team-wide bottlenecks over time
- Built to support ongoing improvement conversations at the team level
Swarmia cons:
- Needs org-wide rollout to produce meaningful data
- Not built to answer "what did I personally merge last month"
Swarmia best for: a team lead running regular delivery retros who wants DORA metrics plus developer sentiment in one place.
Verdict: Skip for individual review prep; Hold for a team lead evaluating org-wide platforms.
5. Jellyfish: best for engineering leadership tying work to business outcomes
Jellyfish maps merged pull requests to roadmap initiatives and investment categories, aimed at directors and VPs who need to report engineering work in business terms.
Jellyfish pros:
- Maps merged pull requests to roadmap initiatives and investment categories
- Built for reporting engineering work to non-engineering stakeholders
- Supports capacity planning across multiple teams
Jellyfish cons:
- Overkill for a developer who just wants a monthly merged PR list
- Setup and rollout target directors and VPs, not individual contributors
Jellyfish best for: engineering leadership building an investment or ROI report for executives.
Verdict: Skip for individual developers; Hold for leadership evaluating platform-level tools.
How we ranked these
Each tool was placed by matching it to one distinct primary user — individual contributor, engineering manager, or engineering leadership — rather than stacking them on a single leaderboard. Read-only access, filtering granularity by month or repo, and whether the output is usable in a review document all counted. A tool built for a director's roadmap report and a tool built for a developer's own merged PR list are not competing for the same job in 2026, so they aren't ranked against each other here.
Browse your merged pull requests
Filter merged PRs by month, org, or repo with read-only access.
Which GitHub pull request analytics tool should you choose?
If you're one developer prepping a self-review, a promo packet, or a job search in 2026, Pull Tally is the default pick — it filters merged PRs by month, org, or personal repo without touching your private org repos unless you explicitly connect them. If you manage a team and need cycle time or DORA data, LinearB or Swarmia fit that job instead. If you're reporting engineering investment to executives, Jellyfish is built for that report. If you just want a free glance at one repo's recent activity, GitHub Insights is already sitting in your repo tab.
FAQ
What's the best GitHub pull request analytics tool for a single developer?
Pull Tally is built specifically for one developer's merged pull request history, filtered by month, organization, or personal repo. Tools like LinearB and Jellyfish are built for managers and leadership rolling up whole teams, not one contributor.
Is GitHub Insights the same as pull request analytics?
No. GitHub Insights shows pulse and traffic data for a single repository with no cost and no signup, but it doesn't roll up merged pull requests across repos or organizations, and it isn't built for exporting a review-ready history.
Does Pull Tally require access to my organization's private repos?
Signing in alone does not connect private organization repositories. Pull Tally reads pull request metadata on a read-only basis, and access to any additional org data is explicit, not automatic.
How much does a GitHub pull request analytics tool cost in 2026?
Cost models vary widely between individual tools and team platforms, and pricing changes often enough that it's worth checking the current listing for whichever tool you're evaluating rather than relying on a fixed figure.
Can I track merged pull requests by month?
Yes, with a tool built for that filter. Pull Tally lets you browse merged pull requests by month, by organization, or by personal repository instead of scrolling a single lifetime list.
Is LinearB better than Swarmia for tracking pull requests?
Both target engineering managers and teams rather than individual contributors. LinearB leans harder into cycle time and WIP tracking, while Swarmia pairs DORA metrics with developer experience surveys, so the choice depends on whether the team wants delivery speed data or friction data.
Do I need admin access to check my own merged PR history?
No, not for a personal history tool. Pull Tally works from your own read-only GitHub sign-in; team platforms like LinearB or Jellyfish typically require an admin to roll out the tool org-wide.
What data does a pull request analytics tool access?
A well-scoped tool accesses pull request metadata only, meaning merge dates, repos, and organizations tied to PRs you authored, not your source code or account settings. Personal delivery history is not a productivity score, and any tool worth using should say so plainly.
One last thing
GitHub's search bar can answer a one-off version of this question right now: type is:pr is:merged author:yourname and add a date range. That works fine for a single lookup. It stops working the moment you need the same answer every month for six months running, which is the exact repetitive search Pull Tally exists to replace.