
Engineering managers comparing engineering metrics tools in 2026 are usually solving one of two different problems: measuring how a whole team ships code, or figuring out what one developer actually shipped. Confusing the two wastes a quarter building the wrong dashboard.
- LinearB is the best overall engineering metrics tool for engineering managers running full DORA reporting in 2026.
- Jellyfish wins for mapping engineering work to business investment categories a board actually reads.
- DX (formerly GitPrime) is strongest for benchmarking your org's cycle time against industry peers.
- Pull Tally isn't a team dashboard — it browses one developer's own merged PR history, not a productivity score.
- Every legitimate engineering metrics tool asks for read-only git access; a write-scope request is a red flag.
Why this matters
Most 'best engineering metrics tools' roundups in 2026 lump team dashboards and personal trackers into one ranking, which is how managers end up rolling out a platform built for fifty engineers to solve a problem one developer had. Pull Tally sits at the personal end of that spectrum: it browses and tallies merged pull requests for one GitHub account, by month, by organization, or by repository, and does nothing else. The other six tools below sit at the team end, pulling git and CI data across a whole org to report DORA metrics, cycle time, and investment allocation.
Knowing which end of that spectrum your actual problem sits on saves a rollout meeting and a few weeks of dashboard configuration nobody asked for.
What makes the best engineering metrics tool for engineering managers
- Pulls data automatically from the git host and CI/CD system — no manual timesheet entry
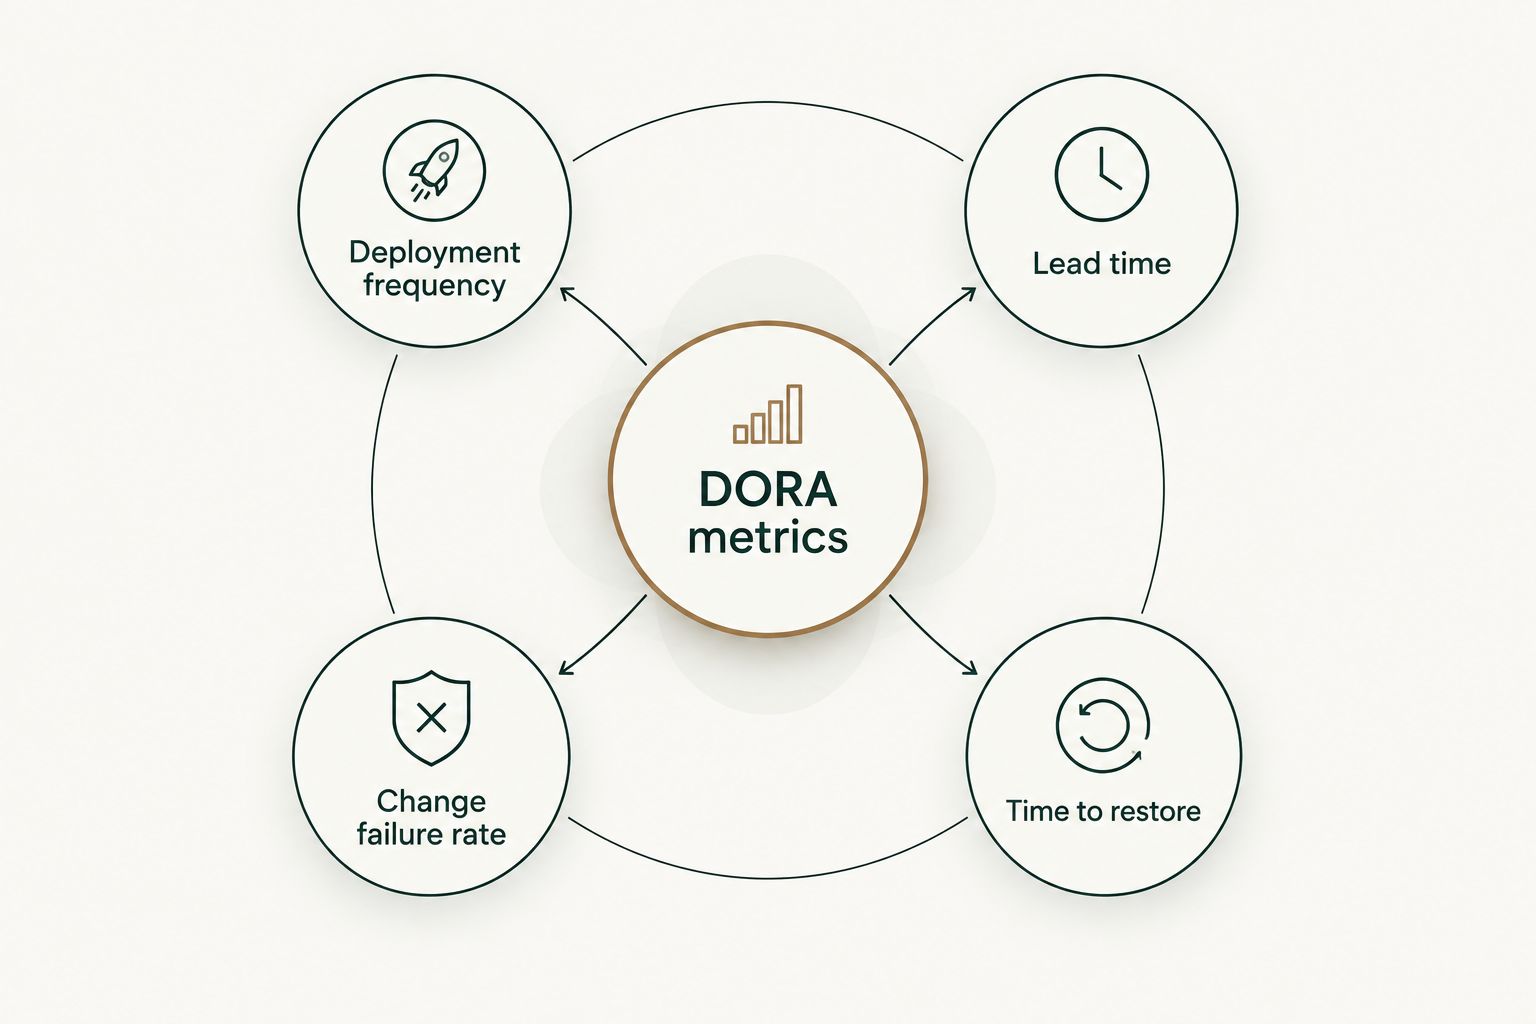
- Reports DORA metrics (deployment frequency, lead time for changes, change failure rate, mean time to restore) out of the box
- Requests read-only, least-privilege repo access — no write scopes bundled in for a dashboard feature
- Separates individual-level detail useful for 1:1s and self-reviews from team-level trend lines useful for planning
- Produces reporting that survives a full quarter without re-configuration
- Scales from a five-person squad to a fifty-engineer org without a re-platform
Every tool below gets measured against those six criteria, plus whether it's honest about what it can't do.
Engineering metrics tools at a glance
| Tool | Best for | Standout feature | Key limitation |
|---|---|---|---|
| LinearB | Team-wide DORA reporting | Automated Git + CI ingestion, gitStream workflow gates | Full value needs CI/CD connected, not just the git host |
| Swarmia | Metrics paired with team agreements | Combines DORA data with async team health surveys | Working-agreement setup adds steps beyond a plain dashboard |
| Jellyfish | Business investment reporting | Maps engineering time to roadmap and cost categories | Built for leadership reporting, not day-to-day team ceremonies |
| DX | Benchmarking against peers | Developer experience survey plus git signal, peer-benchmarked | Benchmark value drops for very small, single-team orgs |
| Waydev | Contractor and multi-vendor tracking | Git analytics across many repos and outside contributors | Overkill for one in-house team |
| Haystack | Quick-start single-team dashboard | DORA-style dashboard live without a long setup project | Fewer access controls once you're past one team |
| Pull Tally | Individual PR history | Browse and export your own merged pull requests by month, org, or repo | No team roll-up, no manager-facing dashboard |
1. LinearB: best engineering metrics tool for team-wide DORA reporting
LinearB pulls commit, pull request, and deployment data automatically from git hosts and CI systems, then rolls it into the four DORA metrics plus a cycle-time breakdown across coding, pickup, review, and deploy stages. It also ships gitStream, a workflow automation layer that can flag oversized PRs or missing tests before merge.
LinearB pros:
- DORA dashboard live without manual query building
- gitStream automations catch policy violations before merge, not after
- Cycle-time breakdown by stage helps pinpoint where a team is actually stuck
LinearB cons:
- Full feature set depends on CI/CD being connected, not just the git host
- Team-level defaults can read as surveillance if rolled out without an explanation
- Investment-reporting view is thinner than a platform built specifically for that
Best for: engineering managers who want a DORA dashboard wired straight into CI/CD. Verdict: Buy — if your CI/CD is centralized enough to connect cleanly.
2. Swarmia: best for combining metrics with team working agreements
Swarmia layers git and issue-tracker metrics on top of async pulse surveys and documented working agreements — an explicit definition of done, agreed review-response times, and similar team norms.
Swarmia pros:
- Health surveys catch context raw metrics miss, like burnout signals and meeting load
- Working agreements turn metrics into a two-way conversation instead of a scorecard
- Investment-category breakdown close to what execs ask for during planning
Swarmia cons:
- More setup than a team that just wants a plain dashboard
- Survey participation depends on team buy-in, not just connected data
Best for: managers who want metrics tied to explicit team agreements, not just numbers on a screen. Verdict: Buy
3. Jellyfish: best for business investment reporting
Jellyfish maps engineering time and delivery against roadmap categories — new feature work, tech debt, keep-the-lights-on — so a CTO can show where headcount actually goes. Metrics sit on top of that investment view rather than leading with cycle time.
Jellyfish pros:
- Investment allocation view speaks the language a CFO or board reads
- Pulls from git, project management, and HR systems for a full cost picture
- Strong for headcount-planning conversations, not just sprint retros
Jellyfish cons:
- Heavier lift to configure investment categories correctly
- Less useful for a single team that just wants a cycle-time dashboard
Best for: VPs and directors who need to justify engineering spend to the business. Verdict: Buy for org-level reporting; Skip for a single-team dashboard need.
4. DX (formerly Pluralsight Flow / GitPrime): best for benchmarking against industry peers
DX combines git-based metrics with a structured developer experience survey and benchmarks the results against other organizations in its dataset, answering "is our cycle time actually slow" with outside context instead of a guess.
DX pros:
- Peer benchmarking gives a trend line external context, not just internal history
- Survey component captures friction git data alone misses, like flaky CI or tooling complaints
- Structured framework gives non-engineering leaders a readable way into the numbers
DX cons:
- Benchmark value drops for very small orgs with little comparable peer data
- Survey component needs ongoing participation to stay useful
Best for: multi-team orgs that want to know how they compare, not just their own trend line. Verdict: Buy for orgs above roughly a handful of teams.
5. Waydev: best for tracking contractor and multi-vendor output
Waydev focuses on git analytics across many repositories and external contributor accounts, built for engineering leaders whose delivery is partly outsourced or spread across agencies.
Waydev pros:
- Handles many repos and outside contributor accounts without per-seat friction
- Cost and ROI-style reporting fits vendor-management conversations directly
- Works across multiple git hosts in one consolidated view
Waydev cons:
- More than a single in-house team typically needs
- Contractor-focused framing can read as adversarial if pointed at in-house staff
Best for: managers overseeing contractor or agency engineering output. Verdict: Hold — only if contractor oversight is the actual problem you're solving.
6. Haystack: best for a quick-start dashboard for one team
Haystack focuses on getting a DORA-style dashboard live for a single team fast, without the longer configuration project the platforms above require.
Haystack pros:
- Faster to stand up than platforms built for multi-team rollouts
- Lower governance overhead for a startup or small team
- Dashboard-first, without forcing a survey or working-agreement process on day one
Haystack cons:
- Fewer role-based access controls as an org grows past one team
- Less benchmarking and investment-reporting depth than the larger platforms above
Best for: a single engineering team that wants DORA metrics without an enterprise rollout. Verdict: Buy for one team; re-evaluate once you're past a handful of squads.
7. Pull Tally: best for individual PR history, not team-wide metrics
Pull Tally isn't built to replace anything above — it does something none of them do well. One developer signs in, browses their own merged pull requests by month, by organization, or by personal repository, and exports the list. Access is read-only, scoped to pull request metadata, and signing in alone does not connect private organization repositories. It's built for the moment a self-review or a job search needs a plain list of what actually shipped, not a productivity score.
Pull Tally pros:
- Read-only access, explained plainly, with nothing connected until you pick an org
- Filters merged PRs by month or repo faster than a manual GitHub search for merged pull requests session
- Output reads as delivery history, useful for brag documents and self-reviews, not a graded score
Pull Tally cons:
- No team roll-up, no manager dashboard, no DORA metrics
- Doesn't touch code review comments, CI data, or deployment timing at all
Best for: individual contributors — and managers who still merge code — who need their own delivery history for a review cycle, not a team dashboard. Verdict: Buy for personal PR history; Skip if you need team-wide reporting.
See Your Own Merged PR History
Browse merged pull requests by month, organization, or repo.
How we ranked
Each tool got measured against the six criteria above: automated data pull, DORA coverage, read-only access, individual-versus-team separation, durable reporting, and scale. A raw count of merged pull requests in a month is a data point, not a verdict on how good a developer is — the tools that respect that distinction ranked higher than the ones that turn a dashboard into a leaderboard.
“A raw count of merged pull requests is a data point, not a productivity score.”
Which engineering metrics tool should you choose?
If you manage a team and want DORA metrics wired to CI/CD without a heavy configuration project, LinearB wins. If you need to justify engineering spend to a board or CFO, Jellyfish is the better fit. If your problem is one developer — you, or a direct report — needing a clean record of what actually merged this quarter for a review or an application, Pull Tally is the right size tool, and none of the team platforms above will do that job faster in 2026.
FAQ
What's the best engineering metrics tool for engineering managers in 2026?
LinearB is the strongest overall pick for team-wide DORA reporting in 2026, with Jellyfish better suited to exec-facing investment reporting and DX stronger for peer benchmarking.
Is Pull Tally an engineering metrics tool for managers?
No. Pull Tally is built for individual developers to browse and tally their own merged pull request history, not to report on a whole team.
Do engineering metrics tools need write access to my GitHub repos?
No. Legitimate tools request read-only access to pull request and commit metadata. A metrics dashboard asking for write scopes is a sign to look closer at what it's actually doing.
What are DORA metrics?
DORA metrics are four measures of software delivery performance: deployment frequency, lead time for changes, change failure rate, and mean time to restore.
Can a solo developer use a team engineering metrics platform?
Technically yes, but platforms like LinearB, Jellyfish, and Swarmia are priced and built for teams. A personal tracker like Pull Tally fits a single developer's own delivery history better.
Does signing into Pull Tally connect my company's private repos?
No. Signing in alone does not connect private organization repositories. Access stays read-only and scoped to pull request metadata you explicitly choose to browse.
What should a manager measure instead of raw PR count?
Cycle time broken into coding, pickup, and review stages tells more than a raw count of merged pull requests per developer, and it doesn't turn into a leaderboard.
Is DX the same tool as GitPrime?
DX is the current name for the platform formerly known as Pluralsight Flow and, before that, GitPrime. It still combines git-based metrics with a structured developer experience survey.
One last thing
Most engineering metrics rollouts fail on the conversation before the dashboard, not the dashboard itself. A manager who explains exactly what's tracked and why — read-only pull request metadata, not keystroke logging — gets far less pushback in 2026 than one who just flips a tool on for the team. That's the same plain-language approach Pull Tally takes for individual developers, and it's worth copying even if the team-wide tool you end up buying is LinearB or Jellyfish.