
Six tools answer the question "what did I actually do this week" in six different ways, and picking the wrong one means redoing a manual GitHub search in a few months when a review or job application asks for specifics.
Best overall for tracking merged pull requests: Pull Tally. Best for raw coding-time tracking across editors: WakaTime. Best for a free, no-signup glance at recent activity: GitHub's own contribution graph. Each tool measures a different slice of a developer's week, and the wrong pick means you're back on GitHub's search bar in February 2026 trying to remember what you merged in October.
- Pull Tally wins for summarizing merged pull requests by month ahead of reviews or job searches in 2026.
- WakaTime tracks actual coding time inside your editor across languages, not just commits.
- GitHub's contribution graph is free and built in, but only shows a rough activity count.
- RescueTime and Code Time track screen or session time, useful outside pure GitHub work.
- Git log gives raw commit data with zero setup, best for developers who trust the terminal.
Why this matters
A manager asks what you shipped last quarter, or a job application wants recent work — and the honest answer is buried in GitHub notifications and old Slack threads. GitHub's own search bar, with a query like is:pr is:merged author:@me, works fine for one lookup. It breaks down once you need the same answer every month across more than one repository.
That's the gap these tools fill, and they split into two families. Delivery trackers count finished, merged work. Time trackers count hours spent coding, whether or not anything shipped. Both matter, but for a self-review or a resume, delivery counts more than hours logged. For a deeper look at that specific gap, see how to track merged pull requests across a full year instead of one repo at a time.
What makes the best coding activity tracker
- Counts finished work, not open tabs. Merged pull requests and shipped commits, not time spent with an editor open in the background.
- Filters by week, month, or repository. A rolling seven-day view is useless if you can't also pull a full quarter for a review.
- Read-only access. No tool needs write permission to your code to tell you what you already merged.
- Works across repos and orgs. Developers who contribute to more than one codebase need one view, not five browser tabs.
- Exports cleanly. Copy-paste into a resume, self-review, or brag document without reformatting.
- Skips the productivity score. A single number claiming to grade your week tells you less than the actual list of what you shipped.
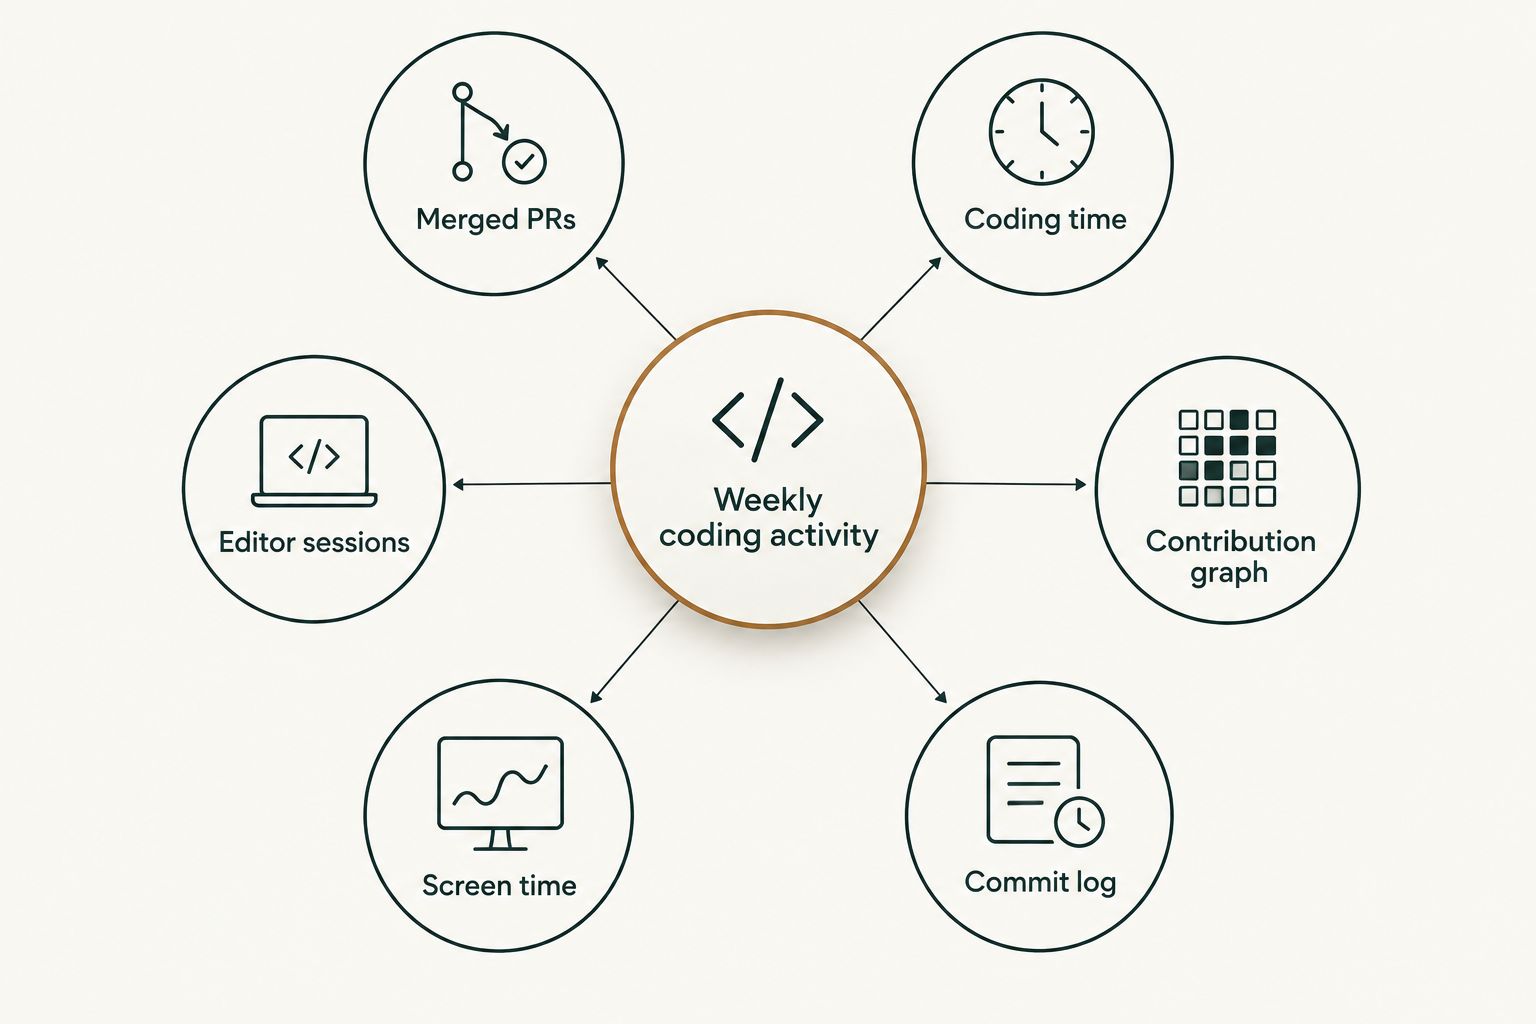
Weekly coding activity trackers at a glance
| Tool | Best for | Standout feature | Key limitation |
|---|---|---|---|
| Pull Tally | Summarizing merged pull requests by month | Groups merged PRs by month, org, or repo with read-only GitHub access | Only counts merged pull requests, not raw commits or open drafts |
| WakaTime | Tracking actual coding time across editors | Records active coding minutes per language and project automatically | Measures time at the keyboard, not what actually merged |
| Code Time | Automatic per-session tracking in one editor | Runs as a VS Code extension with zero manual logging | Data stays tied to whichever editor it's installed in |
| GitHub contribution graph | A free, built-in glance at recent activity | Already on every GitHub profile, no signup required | Treats all activity as equal squares, no monthly breakdown |
| RescueTime | Tracking total computer time beyond code | Covers browser tabs and apps, not just the editor | Doesn't distinguish coding from any other screen time |
| Git log (CLI) | Raw commit history with no installs | Pulls exact commit messages and timestamps from the repo directly | Manual filtering by date range, one repo at a time |
1. Pull Tally: best coding activity tracker for merged pull requests
Pull Tally reads pull request metadata from GitHub and groups merged pull requests by month, organization, or personal repository. It's built for the moment a manager asks what you shipped last quarter, or an application asks for recent work — instead of scrolling an activity feed, you filter to a month and see the list. Access is read-only, and signing in alone does not connect a private organization's repositories.
Pull Tally pros:
- Groups merged pull requests by month without a manual GitHub search
- Filters across personal repos and connected organizations from one view
- Read-only access — no write permission to code or repositories
- Built around delivery history, not a graded productivity score
Pull Tally cons:
- Only counts merged pull requests, not commits, drafts, or open PRs
- No coverage of non-GitHub work: tickets, docs, or review comments on someone else's PR
Best for: developers assembling a self-review or job-search summary of shipped work.
Verdict: use it when the question is "what did I merge," not "how many hours did I code."
2. WakaTime: best for tracking actual coding time across editors
WakaTime installs as a plugin across most major editors and logs active coding time per language, project, and file type in the background. It answers a different question than a pull request tracker: not what got merged, but how many hours went into writing it.
WakaTime pros:
- Tracks time automatically once installed, no manual start or stop
- Breaks time down by language and project across multiple editors
- Useful for freelancers billing by the hour or studying focus patterns
WakaTime cons:
- Time spent coding doesn't always match what actually shipped or merged
- Requires installing and maintaining a plugin in every editor used
Best for: developers who want hours-at-the-keyboard data, not delivery history.
Verdict: use it alongside a delivery tracker, not instead of one.
3. Code Time: best for automatic session tracking inside one editor
Code Time is a VS Code extension that logs coding sessions, keystrokes, and time-in-file with no manual setup beyond installing it. It's narrower than WakaTime by design — one editor, one dashboard.
Code Time pros:
- Zero manual logging once installed
- Session-level detail down to individual files
- Lightweight, single-editor setup
Code Time cons:
- Data doesn't travel with you across editors or machines
- Doesn't connect to GitHub, so it can't tie a session to a specific merged pull request
Best for: developers who live in one editor and want session-level detail there.
Verdict: use it if VS Code is your only editor; skip it otherwise.
4. GitHub contribution graph: best free glance at recent activity
Every GitHub profile ships with a contribution graph covering roughly the past 12 months, with each square representing a day of activity. It's the fastest way to see whether a week was active or quiet, and it costs nothing because it's already there. For a dashboard built specifically around pull requests instead of daily squares, the roundup of GitHub PR dashboard tools for solo developers goes further.
GitHub contribution graph pros:
- Free and built into every profile automatically
- No signup, install, or permission grant needed
- Good for a quick outside-in read of anyone's activity, including your own
GitHub contribution graph cons:
- Squares don't distinguish a one-line commit from a 40-file pull request
- No monthly totals, no repository filter, no export
Best for: a ten-second gut check, not a report handed to a manager.
Verdict: use it for a glance; skip it for anything you need to present.
5. RescueTime: best for tracking total computer time beyond code
RescueTime runs in the background across a whole machine, logging time in every app and browser tab, not just the editor. For developers who want to see how much of the day actually goes to coding versus meetings and Slack, it's the closest thing to a full picture.
RescueTime pros:
- Covers the entire workday, not just time in an editor
- Useful for spotting how much of a week is lost to context-switching
- Works without touching GitHub or any repository
RescueTime cons:
- Doesn't distinguish coding from any other keyboard activity
- Nothing here maps to what was actually merged or shipped
Best for: developers auditing their whole workday, not just their commit history.
Verdict: use it for time-audit questions; it won't answer "what did I ship."
6. Git log (CLI): best for raw commit data with no installs
Running git log --author="you" --since="2026-01-01" pulls exact commit timestamps and messages straight from a repository, with nothing to install and nothing sent to a third party. It's the rawest version of coding activity data available.
Git log pros:
- No installation, signup, or third-party access to your code
- Exact commit messages and timestamps, not an estimate
- Works offline, on any repo you have locally
Git log cons:
- Manual filtering by date range, one repo at a time
- No monthly grouping, no cross-repo view, no export ready for a review document
Best for: developers who want raw data and don't mind assembling it themselves.
Verdict: use it for a one-off check; it's not a repeatable monthly habit.
How we ranked
Ranking follows how directly each tool answers "what did I ship this week," starting with tools that group merged work automatically, moving through time-tracking and free built-in options, and ending with manual methods that need the most setup. The criteria above — counting finished work, filtering by date, read-only access, clean export — decided the order, not brand size or install count.
Which tool should you choose?
If a performance review or job application needs a list of what actually merged in 2026, Pull Tally covers that in minutes without a manual GitHub search. If you bill hourly or study your own focus, pair it with WakaTime or Code Time for time data. If you just want to see whether last week was busy, GitHub's own contribution graph is free and already on your profile. For the review conversation itself, a wider self-review toolkit covers more than just pull request counts.
Browse your merged pull requests
Read-only GitHub access. See monthly summaries in minutes.
FAQ
What's the best tool to track weekly coding activity in 2026?
It depends on the question you're answering: Pull Tally groups merged pull requests by month for reviews and job searches, while WakaTime tracks actual coding time across editors. Pick based on whether you need delivery history or hours worked.
Is WakaTime better than GitHub's contribution graph?
They measure different things — WakaTime tracks active coding time per language and project, while GitHub's graph shows a rough daily activity count with no monthly breakdown. WakaTime gives more detail; the contribution graph is free and needs no install.
Does Pull Tally see my time spent coding?
No. Pull Tally reads merged pull request metadata, not keystrokes or editor time. It answers what you merged, not how many hours you worked.
Is Pull Tally's GitHub access read-only?
Yes. Signing in reads pull request metadata only, and signing in alone does not connect a private organization's repositories.
Can I track merged pull requests without installing anything?
Yes — GitHub's search bar with a query like is:pr is:merged author:@me works for a one-off lookup. A repeated monthly habit across repos is where a dedicated tool saves the manual filtering.
How do I track coding activity across multiple GitHub organizations?
Tools that group merged pull requests by organization cover this in one view; git log and GitHub's contribution graph require checking each repository or organization separately.
Does tracking weekly coding activity require a productivity score?
No. Merged pull requests, coding time, and commit logs are raw activity counts, not a graded score — a list of what you shipped tells a manager more than a single number claiming to rate your week.
One last thing
GitHub's contribution graph counts a one-character typo fix the same as a 40-file refactor — the square doesn't know the difference. If a review or application needs to show what actually shipped in 2026, the pull request list itself, filtered to what merged, says more than any graph square ever will.